Help information (instruction)
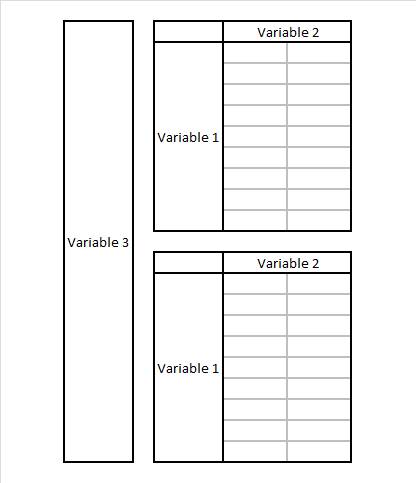


This form makes it possible for you to choose a variable to see the total of people that has been counted with these characteristics in cross tabulations (acronyms: crosstabs). For more information about cross tabulation see wikipedia about cross tabulations. . All questions results of the questions asked during the interview of the census are stored in a variable. To see which variable you are looking for be referred to the questionnaires and search options.

The crosstabs options are:

These are the variables which you can choose to make cross tabs. In the crosstab option you can use 1, 2 or 3 variables. To guarantee that no entity can be identifiable the third variable you can choose is whether age or sex. In the first and second variable you can select any persons variables to put in the rows of the tabulation.

Area break level is for instances the counts for variable sex and then group by region. For instance you want to know how many people lives in noord which are female. Or also you can choose the second level of area break level (Zones). Zones are ‘districts’ within regions.

The percentage options give you the following flexibility:

·         You could choose to show total counts per aggregation

·         You could choose to show %Row of total counts per aggregation

·         You could choose to show %Colom of total counts per aggregation

·         You could choose to show %Total of the total counts per aggregation

The output format you can choose tables or graph.


Back               More topics on how to ….